Shading a Triangle in Software [C++]
I find it fun to reimplement GPU behaviors in software for learning purposes and wanted to share my intuition for how the shading of a triangle can be done with some simple linear algebra.
Defining a Triangle
A triangle can be defined by three points or vertices. Each vertex has various attributes associated with it; for now, we’re just going to give each vertex a position on the screen.
So if we wanted to draw a triangle with a vertex in the bottom left corner, the bottom right corner, and the top middle corner, we would define it like this:
| |
This will be key later on.
Each vertex has a position made of two floating point values. There are two because when working with the screen we only have two dimensions: width (x) and height (y).
The origin of the screen is defined as the top left corner: y values get bigger as we move down and x values get bigger as we move right. So the bottom right corner of the triangle has the largest values.
The Edge Function
So each triangle vertex has a position on screen, but we need to know which pixels on screen are inside of that triangle so that we can color them appropriately. We want pixels in the triangle to be non-black and the pixels outside of the triangle to be black. Some linear algebra will take care of that for us.
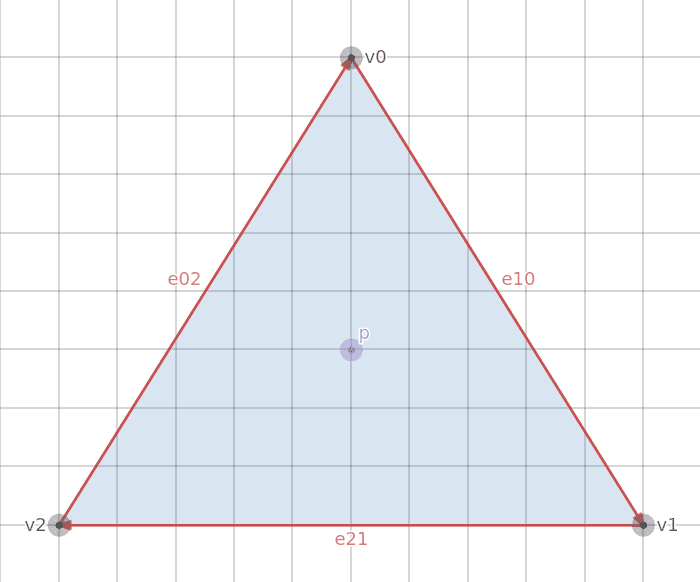
First we’ll create a vector from each vertex to the next adjacent vertex going clockwise by subtracting one vertex position from the other. Recall that Point A - Point B creates a vector pointing from Point B to Point A.
These are the red vectors labeled e10 (v1 - v0), e21 (v2 - v1), and e02 (v0 - v2).
If we want to know whether the Point P is inside the triangle, we can use a property of the cross product of 2D vectors. For each edge (e10, e21, e02), we can do the cross product of that edge vector with a vector from the edge’s origin point to the Point P.
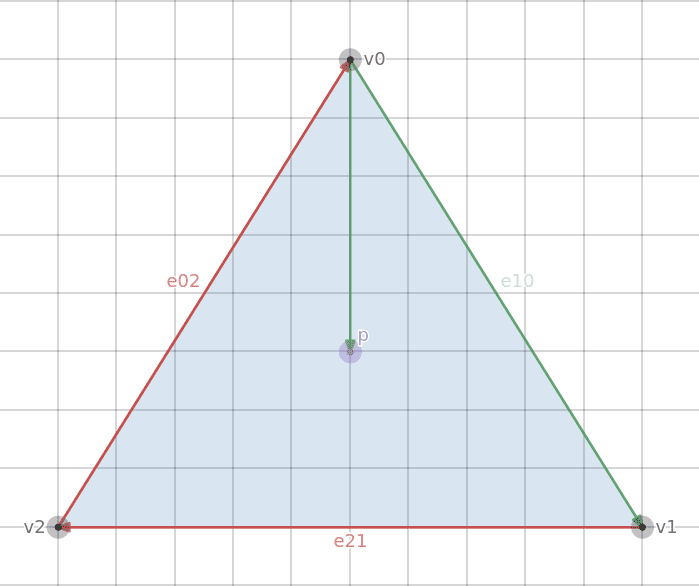
The new vector is the result of the subtraction p - v0 which creates a vector from v0 to p. If we take the 2D cross product of the two green vectors (p-v0 and e10), we get a value that is either negative, positive, or zero.
- Positive: Point P is to the right of e10 (inside the triangle)
- Negative: Point P is the left of e10 (outside the triangle)
- Zero: Point P is on e10 (neither inside nor outside)
We do the same for the other two edge vectors.
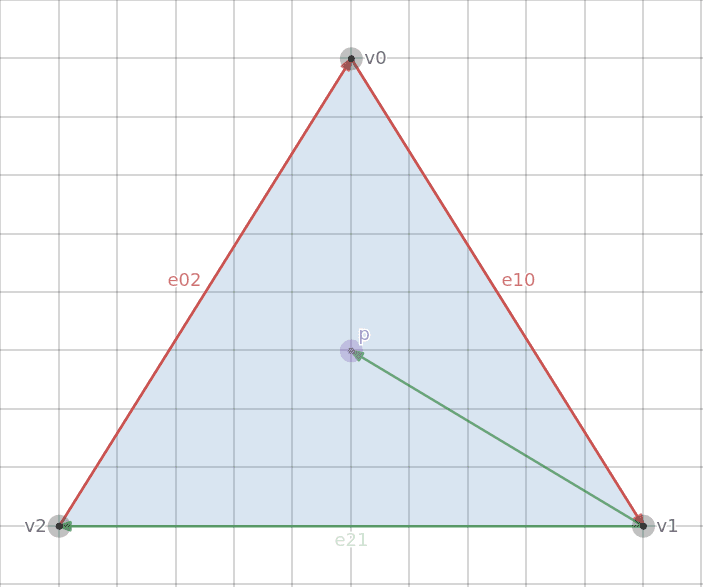
The green vector is the result of the subtraction p - v1 which creates a vector from v1 to p.
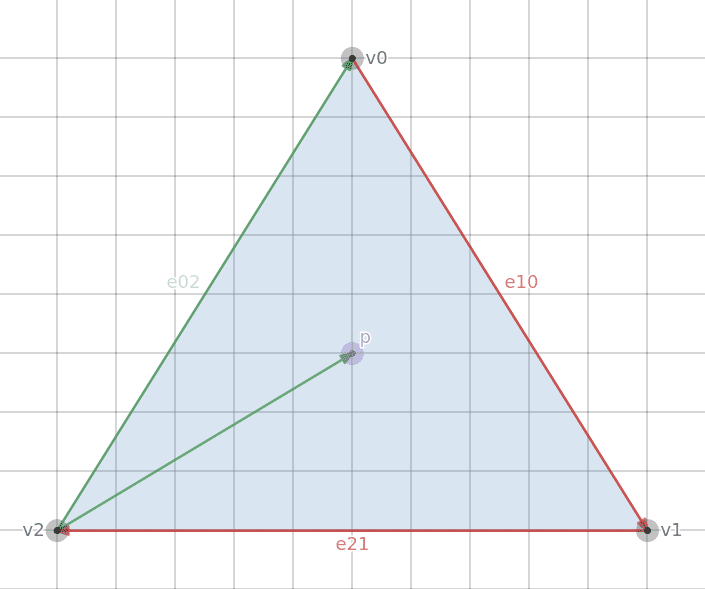
The green vector is the result of the subtraction p - v2 which creates a vector from v2 to p.
The 2D cross product is simple enough:
A x B = A.x * B.y - A.y * B.x
| |
Then if we wanted to test Point P against e10:
| |
What this all means is that if we want to know whether a point is inside of a triangle, we can take the cross products of each point vector with each edge vector. If all of them are greater than (or equal to) zero, then the point is inside the triangle and we can color that pixel.
We can define another structure representing a Vector and overload the subtract operator to create a Vector from the subtraction of two points. The Point and Vector structures have identical contents (two floats) but keeping them separated makes the code more explicit.
| |
Then we create a function that will tell us, given two vertex positions (the edge points) and the point we want to test, the cross product of the vectors from those points.
| |
Drawing a Triangle
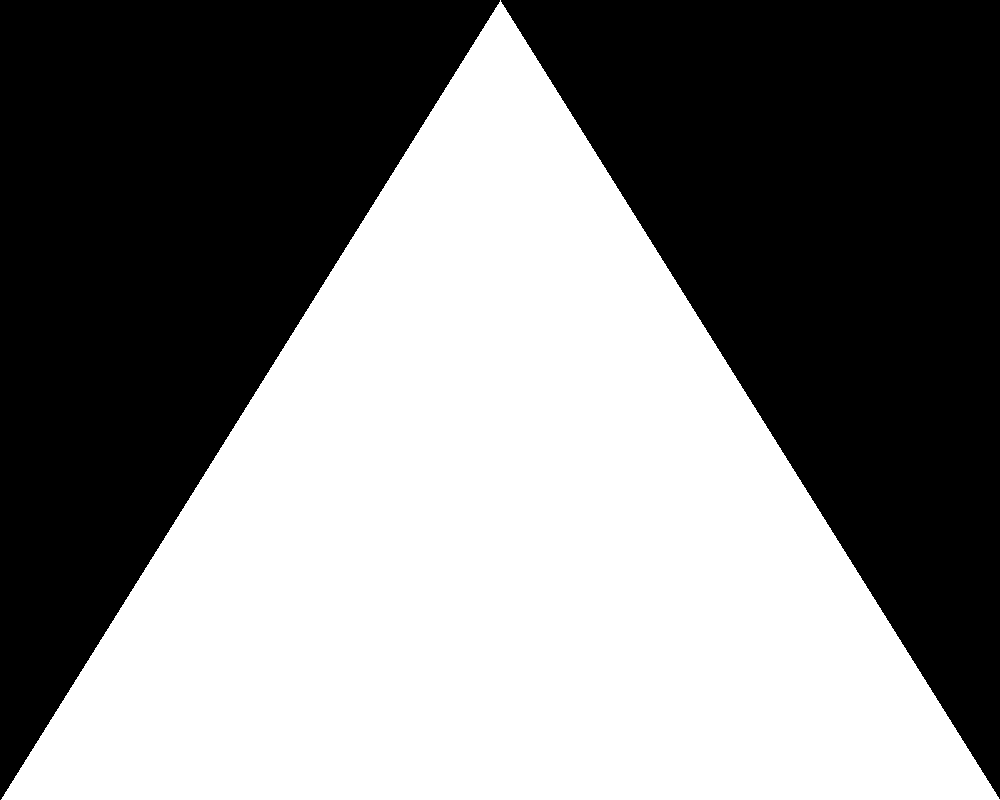
To render the triangle, we iterate over all pixels on the screen and check if that pixel’s position is contained within the triangle. If it is, we color that pixel white. If it isn’t, we do nothing.
| |
That produces this image:
Shading a Triangle
That’s great. We can define a triangle with three points and fill it in with a solid color. Of course a solid color is not the end goal. It would be cool if we could associate other attributes with a vertex besides just position and then interpolate those attributes across the many pixels making up the triangle.
We can accomplish this with something called Barycentric Coordinates. The cross product of two 2D vectors is actually the area of the parallelogram formed by the two vectors. Half of the area of that parallelogram is the area of the sub-triangle that is formed from the two triangle points and the test point.
If we connect the test point to each vertex we can visualize the three sub-triangles making up the larger triangle. The sum of the area of those triangles makes up the area of the entire triangle.
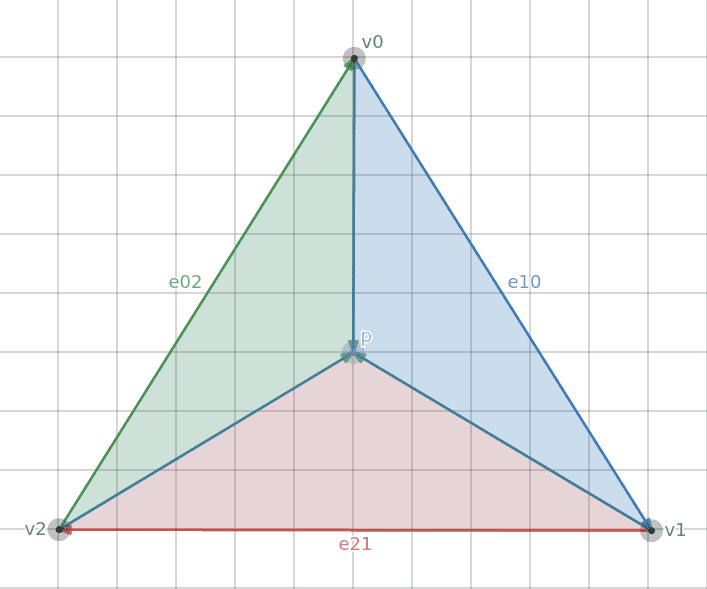
Each of the shaded areas represents a sub-triangle.
If we overlay each subtriangle with its respective area, we see something interesting.
- As Point P gets closer to v0, the area of the red subtriangle gets larger.
- As Point P gets closer to v1, the area of the green subtriangle gets larger.
- As Point P gets closer to v2, the area of the blue subtriangle gets larger.
As point P moves around the triangle, the areas of the subtriangles change depending on the point’s proximity to each of the three vertices. In other words, if we have some attributes associated with each vertex (like a color), then we can use the same cross product function we developed earlier to give us a value that tells us what proportion of each vertex attribute should contribute to the point as a whole.
If we divide each of the results returned from the edge function and divide them by the total area of the main triangle, we’ll get a normalized value (between 0.0 and 1.0) for each vertex. This value is the weight of that vertex on the test point. We can multiply each vertex’s weight with the vertex’s attribute and add the three weighted values together to get the final value.
We can demonstrate this by assigning a color to each vertex.
We’ll create a struct to define a color which is just four floats and add a color variable to the Vertex struct.
| |
We can then redefine the triangle and assign red to v0, green to v1, and blue to v2.
| |
To normalize the weights, we need to divide each by the total area of the triangle which can be found by sending each of the three vertices to the edge function. Then finding the color of a point is a matter of adding up the different weighted colors.
| |
However, because we divide the results of the Edge function (e1, e2, e3) by another result of the Edge function (area), the 1/2 cancels out so we don't have to bother with it.
Results
Running it generates the following shaded triangle:
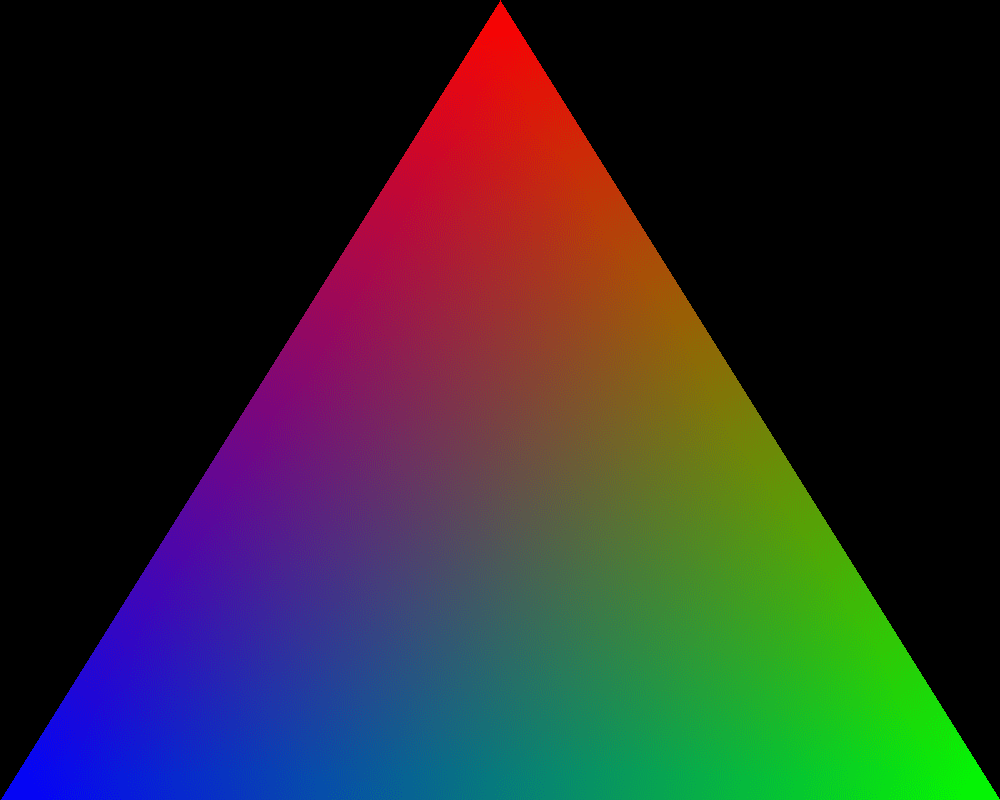
As the pixels get closer to the top vertex, they get more red. As they get closer to the right vertex, they get more green. As they get closer to the left vertex, they get more blue. The areas in between are a combination of colors.
Conclusion
Anyone with experience with a graphics API like OpenGL should be able to see the similarities between what we’ve written here and how you would use OpenGL.
With OpenGL you send a buffer of vertex data to the GPU which contains attributes associated with each vertex (e.g., position, color, normal) and it then interpolates those attributes across the various pixels (fragments) that make up that triangle on screen.
What we’ve done here is similar.
Last Edited: Dec 20, 2022